What is an Infographic: Definition, Benefits, Types and Examples
Surely you are familiar with the term infographic. Seriously, what is an infographic?
Have you ever seen data presented with attractive images that are easy to understand? It could be that what you see is an infographic. The presence of infographics makes data presentation easier to read and understand.
Of course you will be bored and lazy to see the data presented in text form. Well, this infographic packs the data in an attractive visual way. So, it is easy for readers to understand. Here's an article about infographics.
Understanding Infographics
Infographics are a form of combined visualization that includes text and graphics containing data in the form of numbers. Over time, infographics are packaged to be more unique and interesting. The presence of this infographic makes it easier for readers to understand the information in it.
Benefits of Infographics
Of course, infographics have many benefits, especially in conveying information in the form of data that is easily understood by the reader. Of course, the information that is read becomes easy to understand with attractive visuals compared to just text. Here are the benefits of infographics.
1. More Interesting Information
Infographics package information containing data to be more attractive. In its application, infographics apply the design elements of their creation. Starting from the use of charts, shapes, backgrounds, color combinations, to the use of typography that makes infographics look attractive.
Of course, the information that was monotonous was only in the form of text, became more interesting to look at.
2. Be Efficient and Effective
The combination of visuals in infographics makes readers more efficient in digesting information. So, the information conveyed can be understood easily in just a short time.
3. Increase Reading Interest
Unexpectedly, infographics can increase reading interest, you know. How not, you only need to read information in the form of visuals that are presented in an attractive way. Surely you will be curious if you pass it.
Types and Examples of Infographics
Infographics can be packaged in various types of content. The following types and examples of infographics.
1. Static
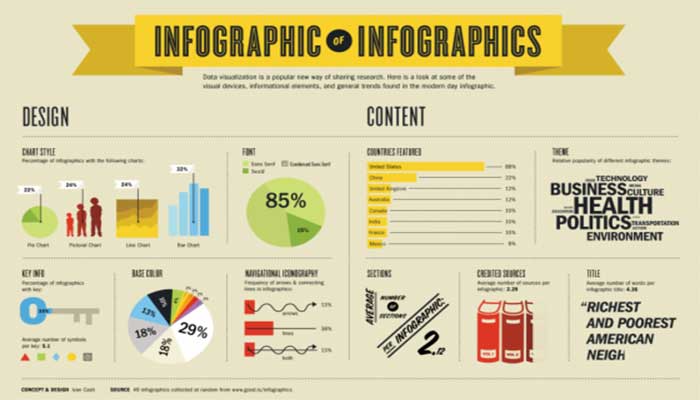
First there is an infographic of the static type. In accordance with the name of the type, this infographic is presented using only visual components without being followed by audio or moving animation. This type of infographic is generally displayed at formal activities, such as presentations on official activities. This static type of infographic can make data presentation easier.
2. Lists

Second, there are list-type infographics or commonly known as lists. This type of infographic generally contains data in the form of a list. Usually this list infographic is used to convey information in the form of steps or how to do certain things.
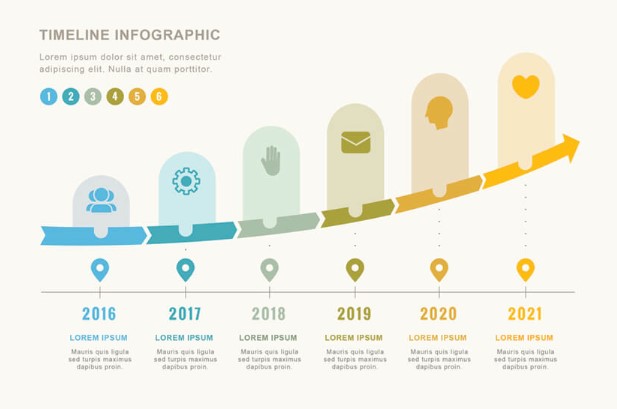
3. Timeline
More Coverage:
Third, there is a timeline type infographic. This infographic is usually used to provide information related to chronological data or the order and time of certain events.
Here's an article about infographics. The presence of infographics makes it easier for readers to understand the information presented. What type of infographic do you prefer?
Get more News and Articles on Google News

Sign up for our
newsletter
Review Order
Monthly
IDR 150.000
Payment Details
Subscribe Monthly
Total payment
By clicking the payment method button, you are read and
agree to the
terms and conditions of Dailysocial.id